វីដេអូផ្សព្វផ្សាយ
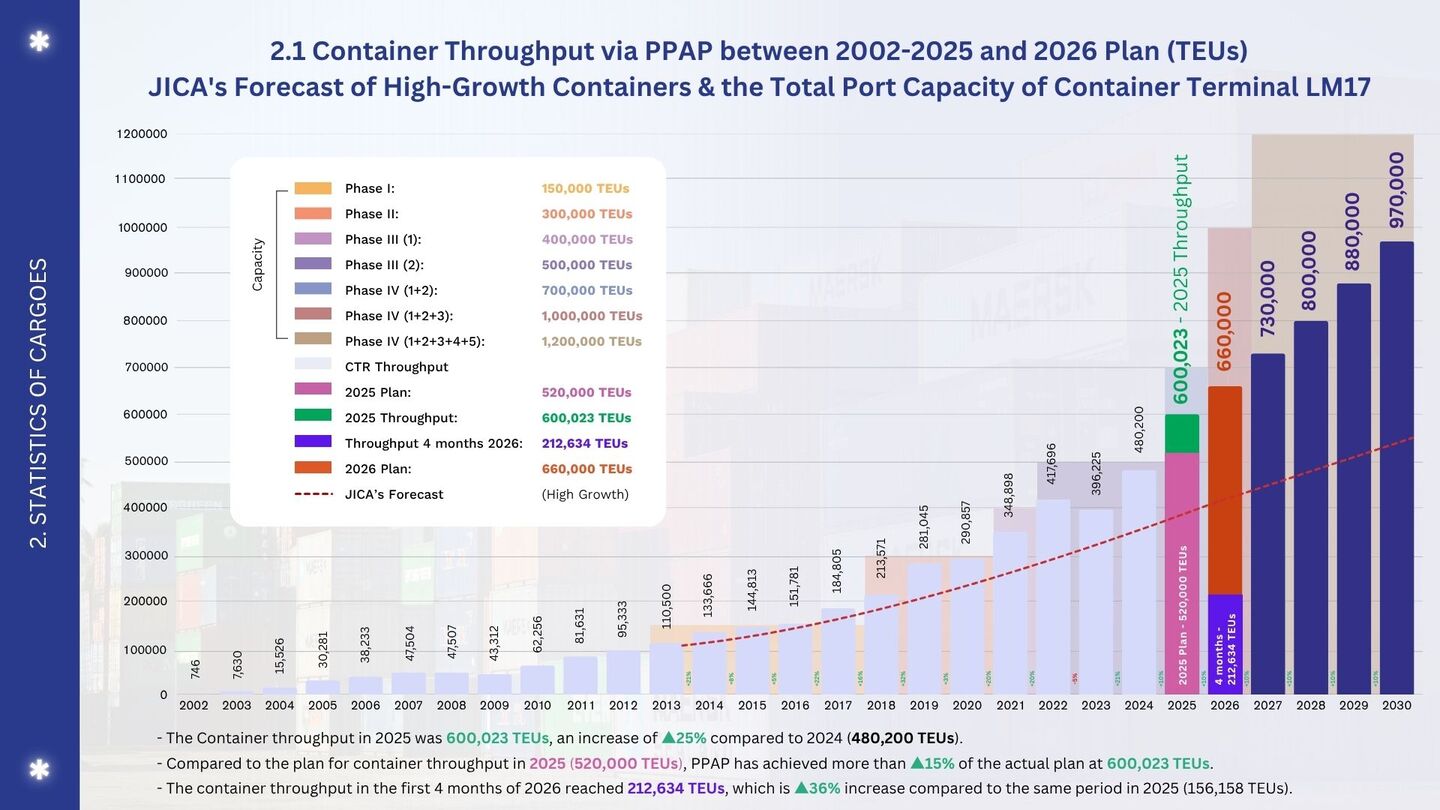
បរិមាណកុងតឺន័រ និងការព្យាករណ៍
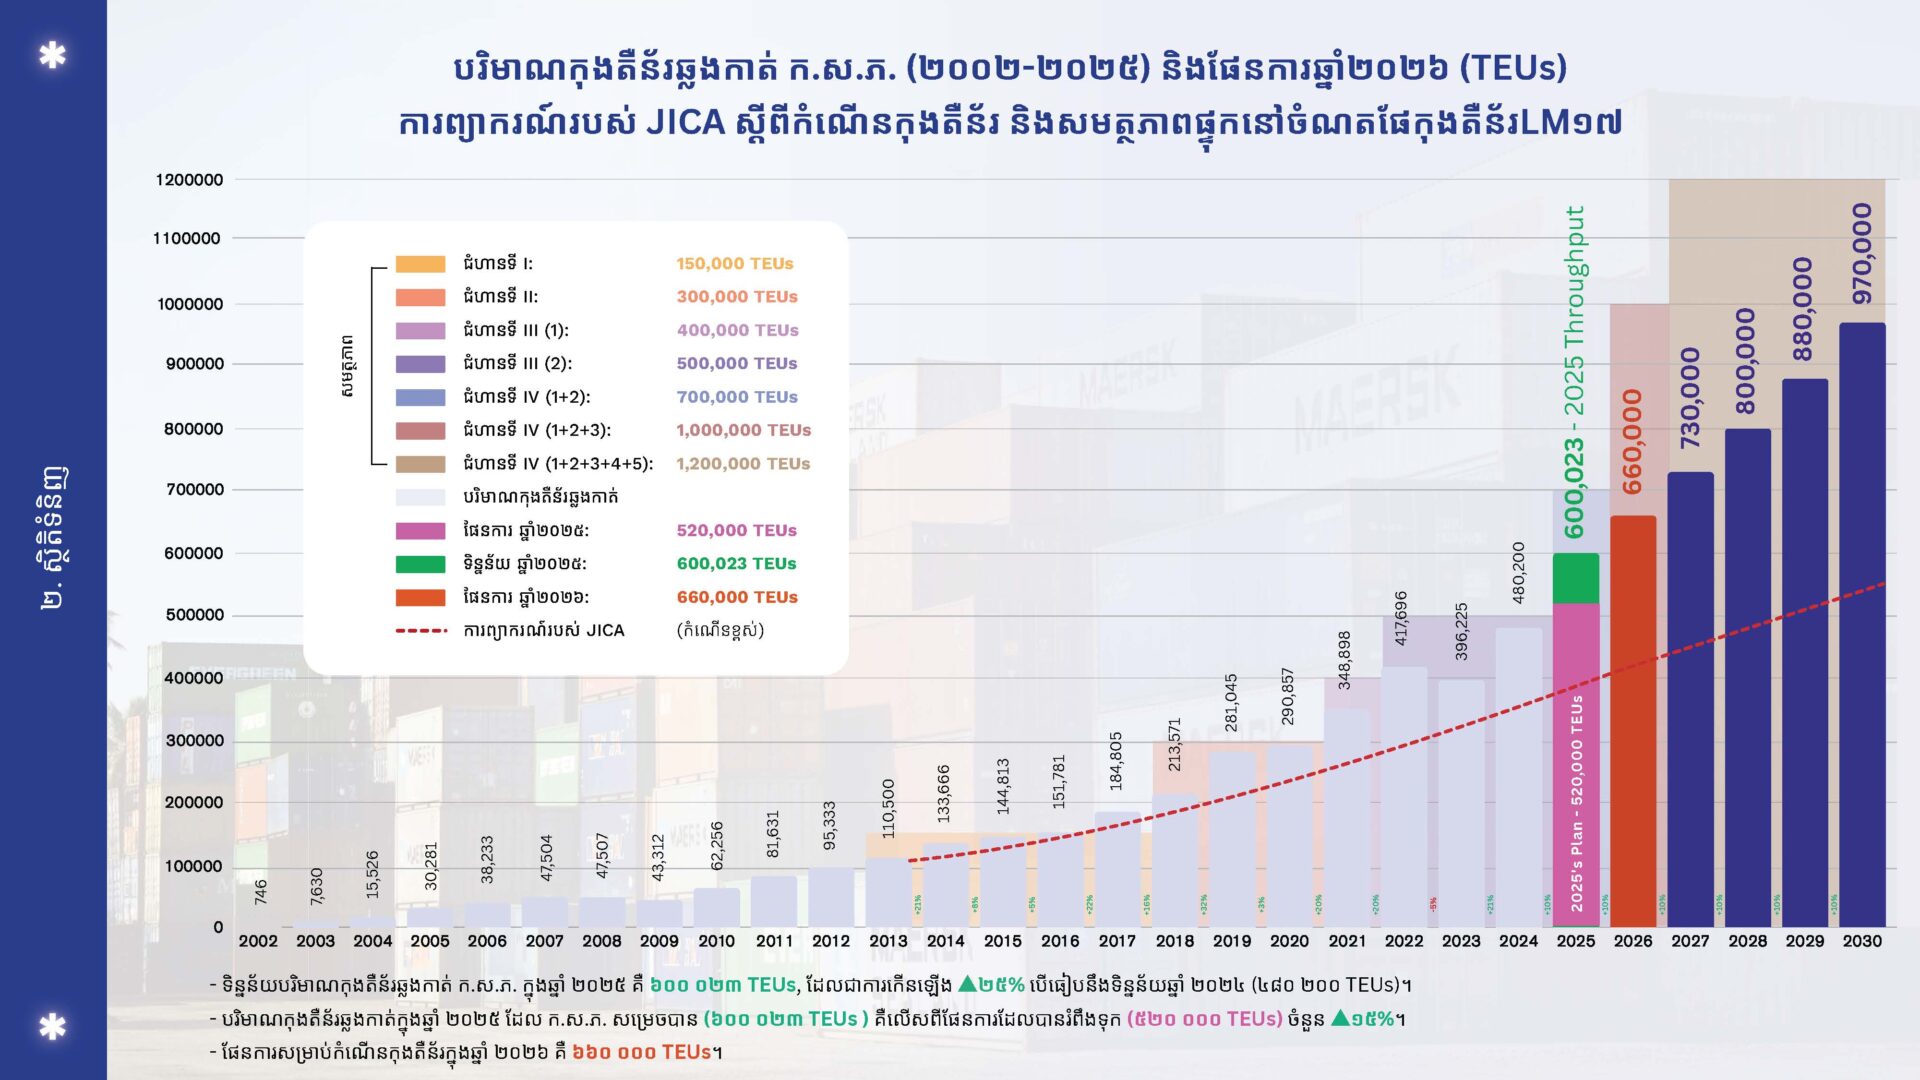
ក.ស.ភ. បានចាប់ផ្តើមដំណើរការលើកដាក់ទំនិញកុងតឺន័រនៅឆ្នាំ២០០២ ដោយមានការរីកចម្រើនយ៉ាងឆាប់រហ័សជាមួយអត្រាកំណើនប្រចាំឆ្នាំជាមធ្យម ៤៤% ចាប់ពីឆ្នាំ ២០០៣ ដល់ ២០០៨។ ទោះបីជាវិបត្តិសេដ្ឋកិច្ចសកល ឆ្នាំ២០០៩ បណ្តាលឱ្យមានការធ្លាក់ចុះបណ្តោះអាសន្នក៏ដោយ ក៏ចរាចរណ៍ទំនិញបានស្ដារឡើងវិញយ៉ាងឆាប់រហ័ស ដោយសារគោលនយោបាយយុទ្ធសាស្ត្ររបស់រាជរដ្ឋាភិបាលលើការនាំចេញអង្ករ និងការបើកដំណើរការកំពង់ផែ Cai Mep Hub នៅខែមិថុនា ឆ្នាំ ២០០៩។ ដោយឡែក បរិមាណដឹកជញ្ជូនបានកើនឡើងជាមធ្យម ១៧% ចាប់ពីឆ្នាំ២០១០ ដល់ ២០២០។ សន្ទុះនេះបានបន្តជាមួយអត្រាកំណើនប្រចាំឆ្នាំ២០% ចាប់ពីឆ្នាំ២០២០ ដល់ ២០២២។ ទោះបីមានការធ្លាក់ចុះ ៥% នៅឆ្នាំ២០២៣ ក៏ដោយ កំពង់ផែបានស្ដារឡើងវិញយ៉ាងខ្លាំង ដោយកើនដល់ ២១% នៅឆ្នាំ២០២៤ និង ២៥% នៅឆ្នាំ២០២៥។
យោងតាមការវិភាគរបស់យើង មានកត្តាសំខាន់ចំនួនបី ដែលបានជំរុញកំណើនជាបន្តបន្ទាប់នៃបរិមាណកុងតឺន័រតាមរយៈ ក.ស.ភ. គឺ៖
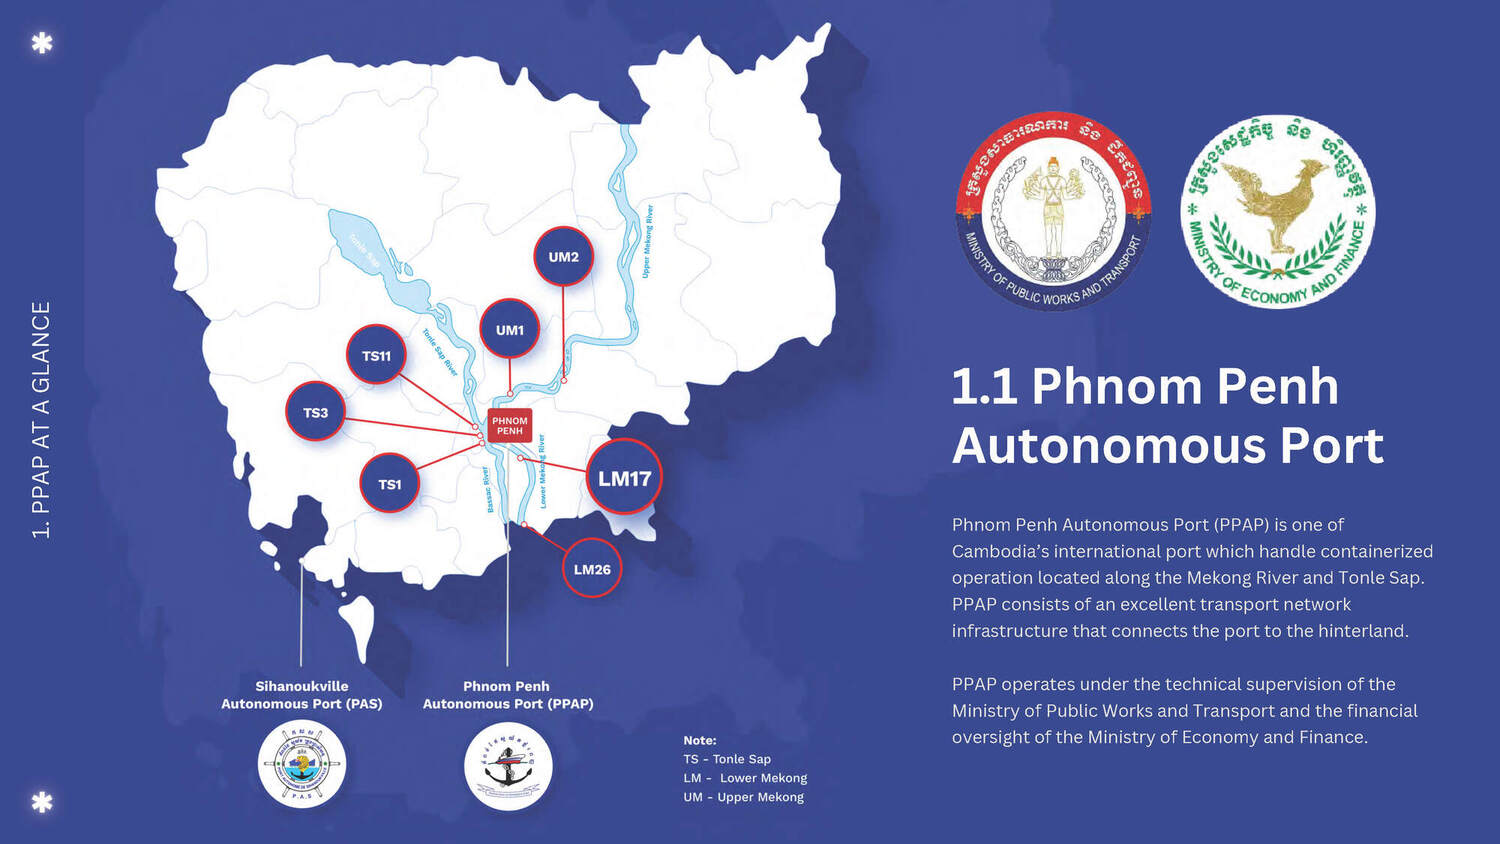
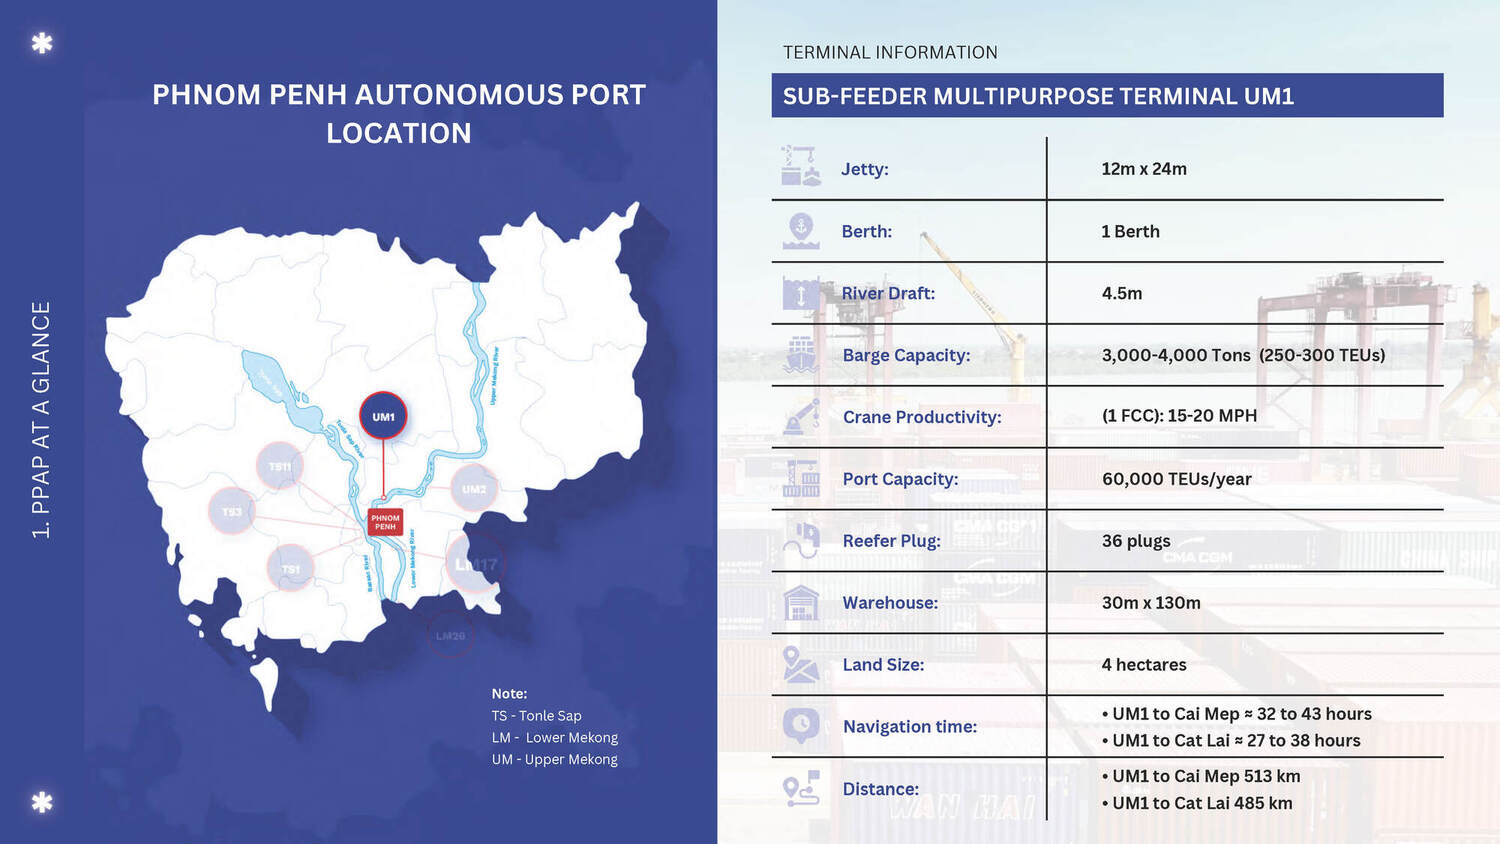
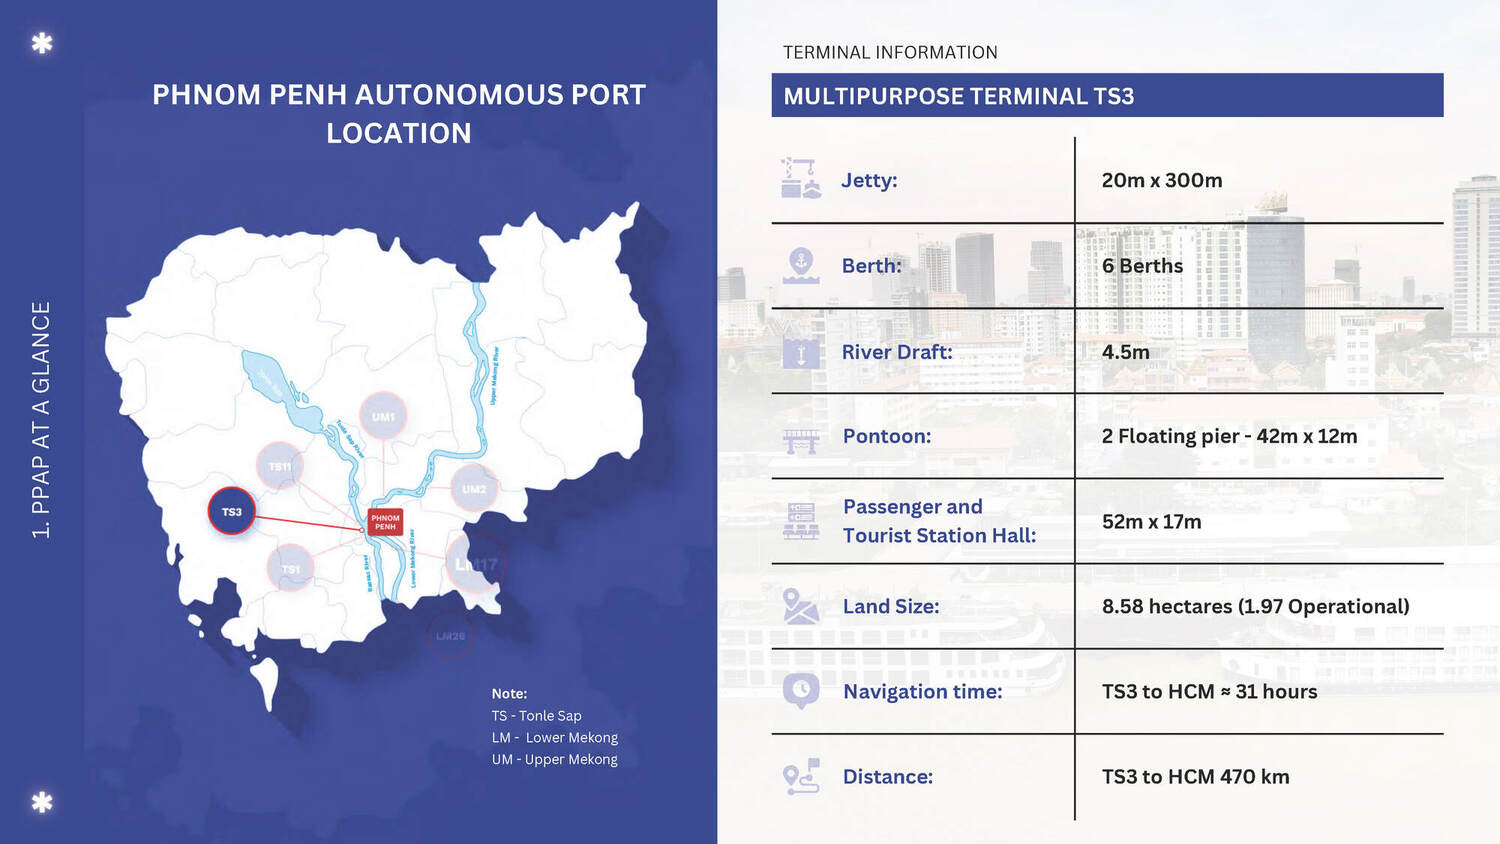
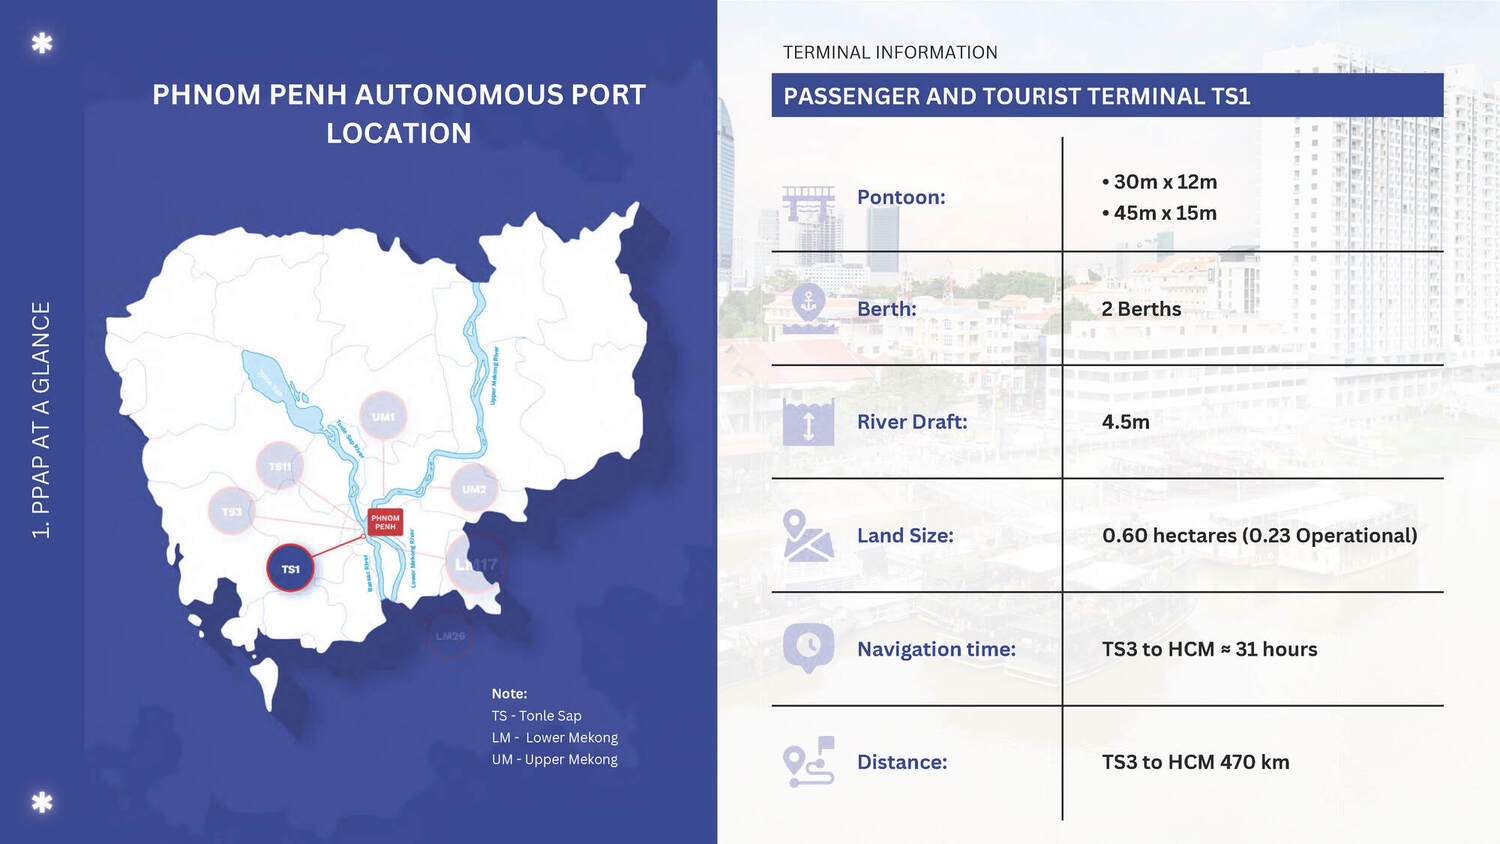
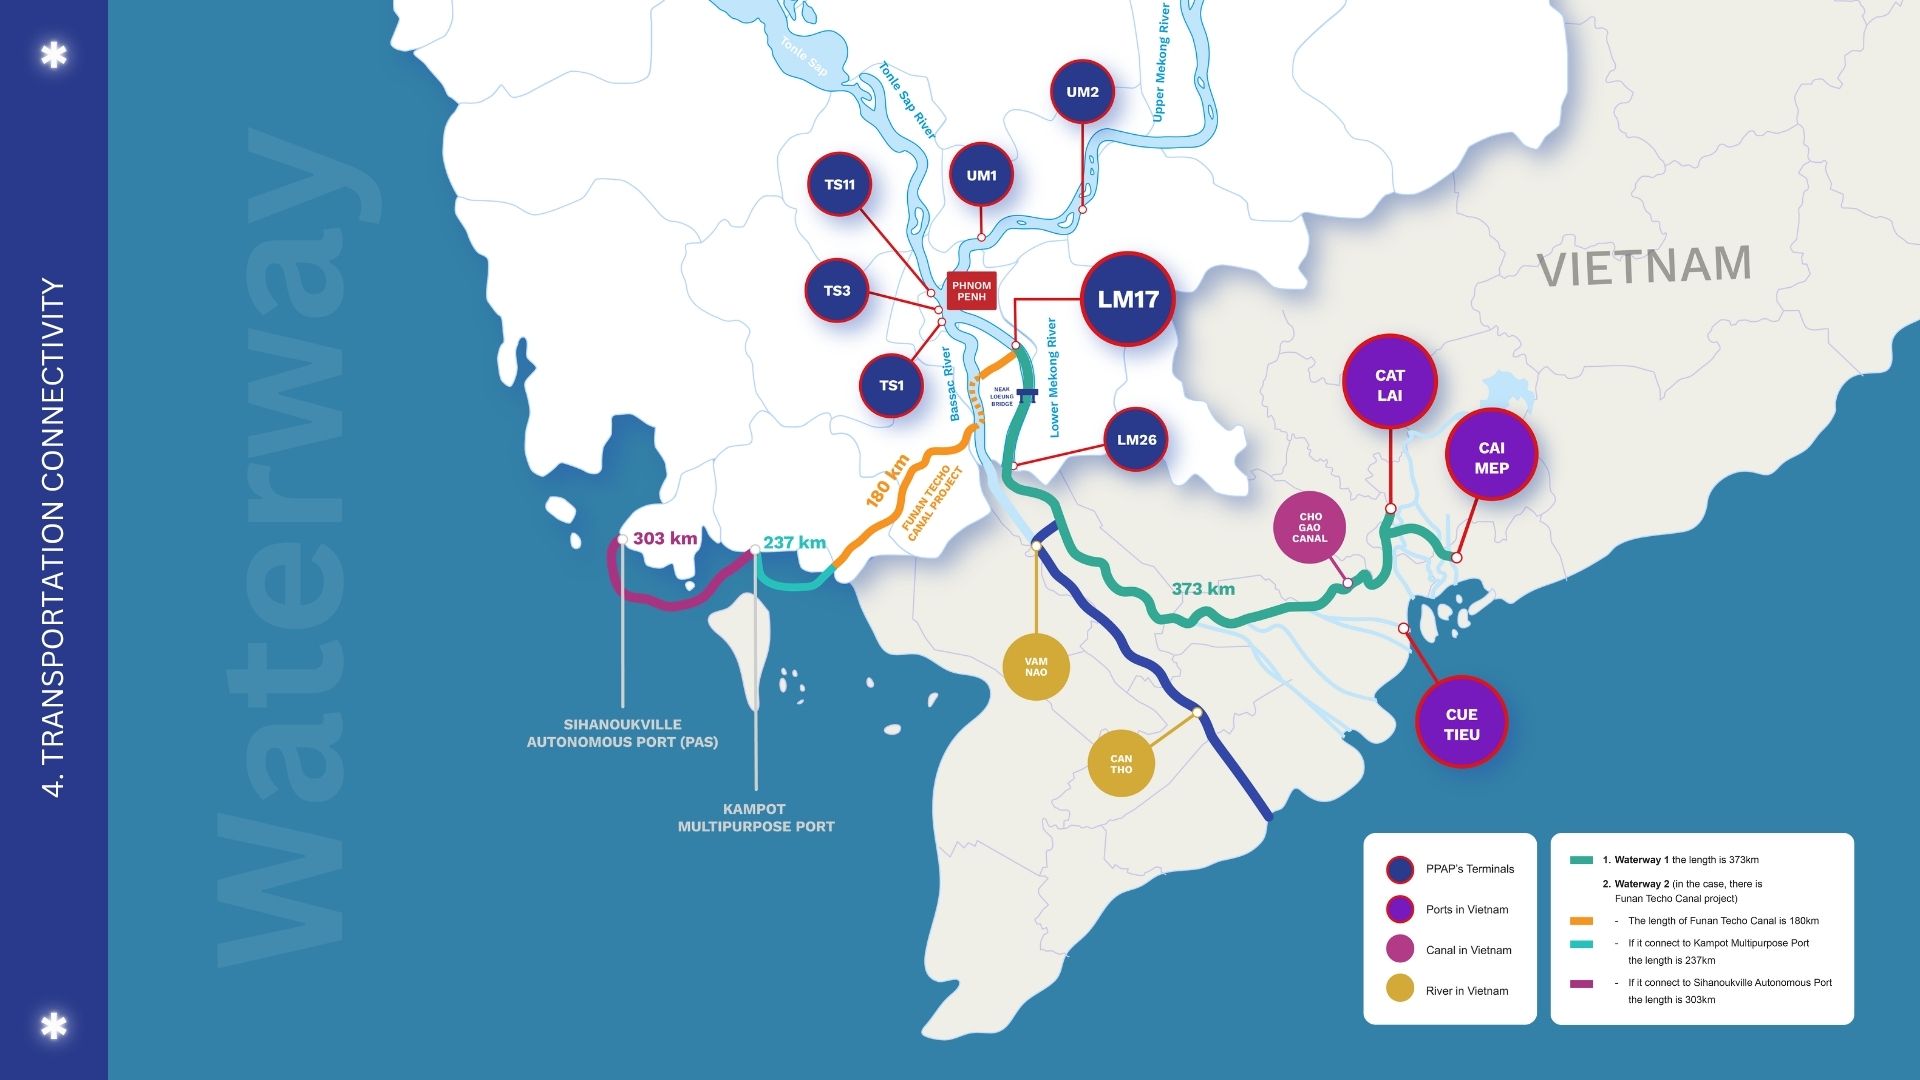
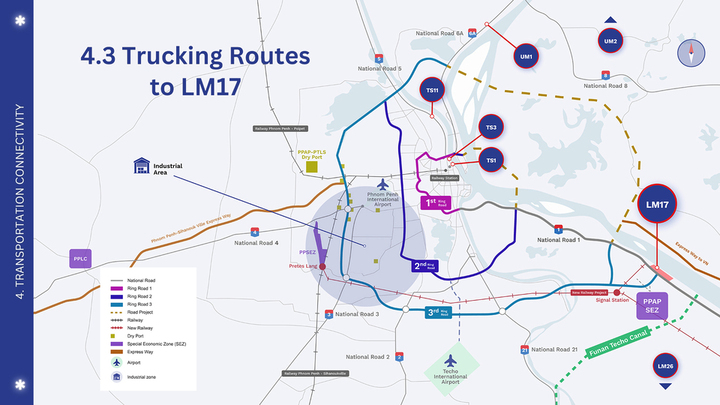
- ទីតាំងយុទ្ធសាស្ត្ររបស់ ក.ស.ភ. ដែលនៅជិតទីក្រុងភ្នំពេញ មានភាពងាយស្រួលសម្រាប់ការប្រមូលផ្តុំ និងចែកចាយទំនិញ។
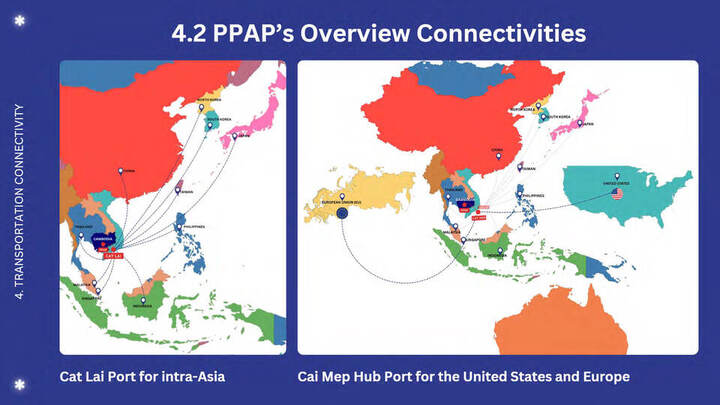
- ការបើកកំពង់ផែ Cai Mep នៅប្រទេសវៀតណាម។
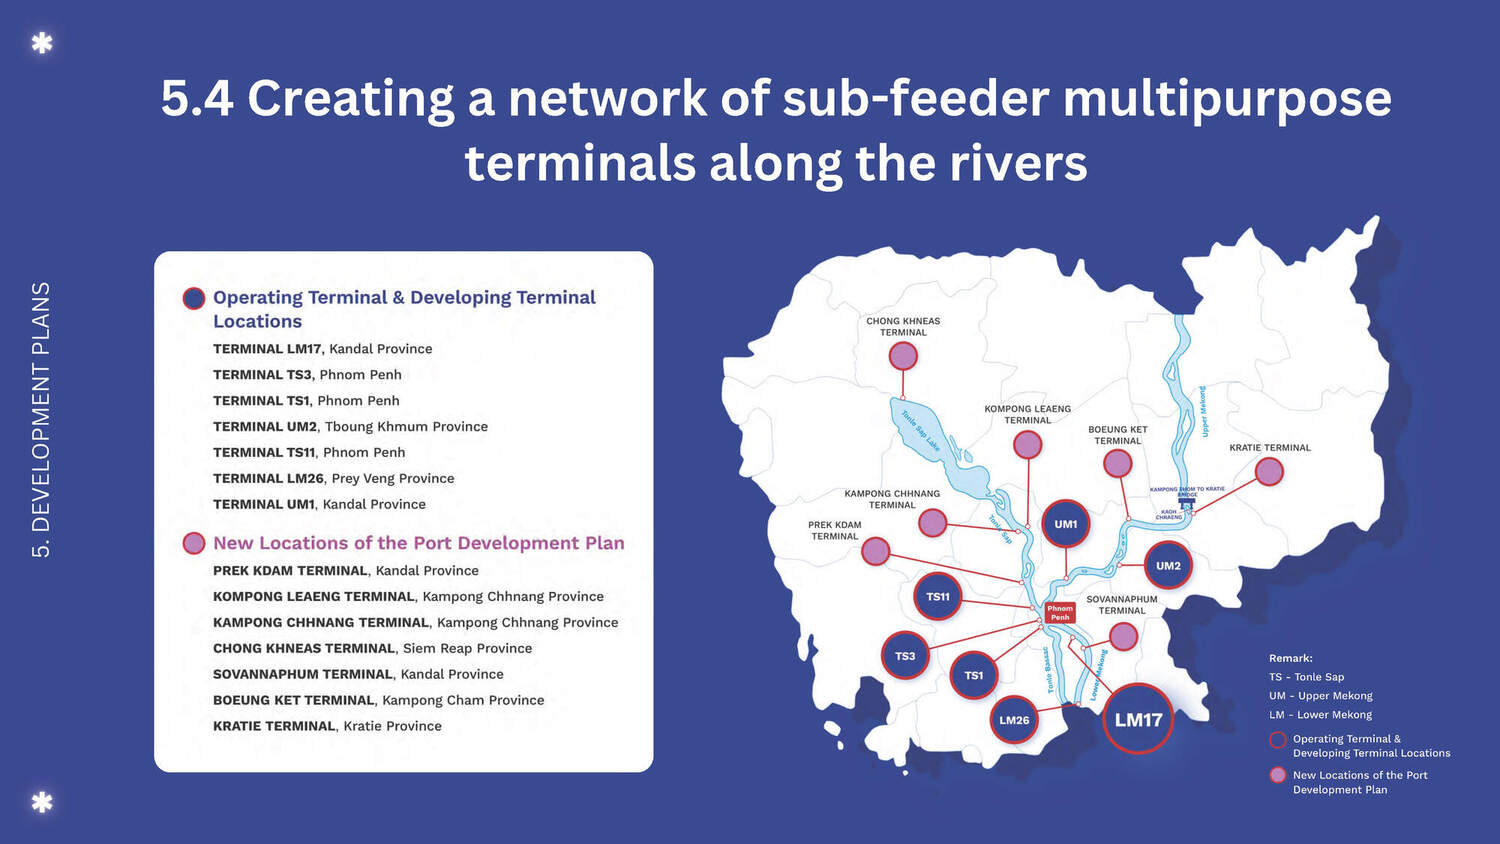
- ការអភិវឌ្ឍបណ្តាញចំណតផែរណបពហុបំណងផ្សេងៗ។